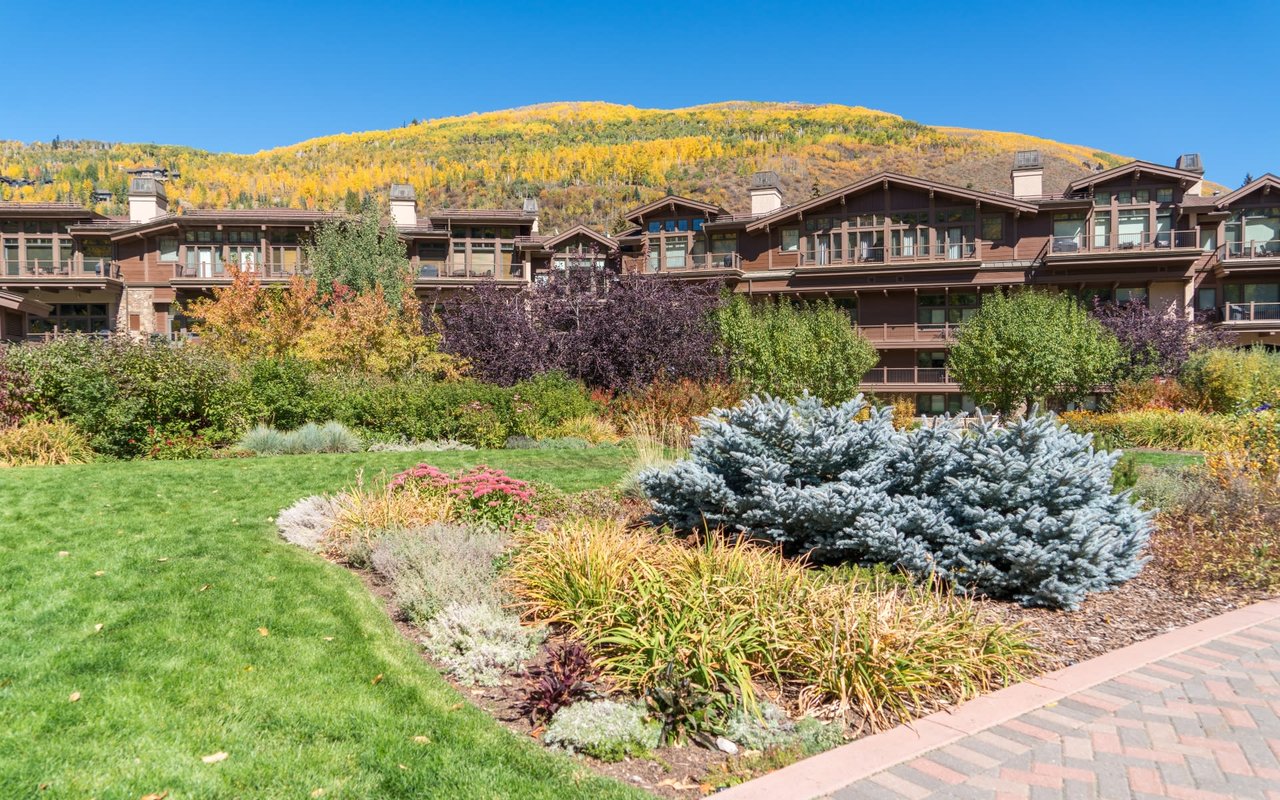
Around Mancos, CO
There's plenty to do around Mancos, including shopping, dining, nightlife, parks, and more. Data provided by Walk Score and Yelp.
57
Somewhat Walkable
Walking Score
44
Somewhat Bikeable
Bike Score
Points of Interest
Explore popular things to do in the area, including Deco Dessert, Fenceline Cider, and Mesa Verde Motel.
| Name | Category | Distance | Reviews |
Ratings by
Yelp
|
|---|---|---|---|---|
| Dining | 0.1 miles | 9 reviews | 5/5 stars | |
| Dining · $$$ | 0.31 miles | 48 reviews | 4.9/5 stars | |
| Dining · $$ | 0.21 miles | 57 reviews | 4.8/5 stars | |
| Dining | 0.25 miles | 16 reviews | 4.8/5 stars | |
| Dining · $$ | 0.27 miles | 47 reviews | 4.7/5 stars | |
| Dining · $ | 0.22 miles | 52 reviews | 4.6/5 stars | |
| Dining | 0.1 miles | 5 reviews | 4.4/5 stars | |
| Dining · $$ | 0.6 miles | 84 reviews | 4.3/5 stars | |
| Dining | 0.24 miles | 2 reviews | 5/5 stars | |
| Dining | 0.31 miles | 2 reviews | 5/5 stars | |
| Dining | 0.25 miles | 33 reviews | 4.2/5 stars | |
| Dining | 0.25 miles | 16 reviews | 4.1/5 stars | |
| Dining · $$ | 0.32 miles | 109 reviews | 4.1/5 stars | |
| Active | 3.79 miles | 12 reviews | 5/5 stars | |
| Active | 3.44 miles | 7 reviews | 5/5 stars | |
| Nightlife | 0.21 miles | 7 reviews | 4.4/5 stars | |
| Beauty | 0.24 miles | 4 reviews | 5/5 stars | |
| Beauty | 0.27 miles | 3 reviews | 5/5 stars | |
|
|
||||
|
|
||||
|
|
||||
|
|
||||
|
|
||||
|
|